<?xml version="1.0" encoding="utf-8"?><feed xmlns="http://www.w3.org/2005/Atom" ><generator uri="https://jekyllrb.com/" version="3.10.0">Jekyll</generator><link href="https://www.themendozaline.org/feed.xml" rel="self" type="application/atom+xml" /><link href="https://www.themendozaline.org/" rel="alternate" type="text/html" /><updated>2026-11-09T01:43:43+00:00</updated><id>https://www.themendozaline.org/feed.xml</id><title type="html">The Mendoza Line</title><subtitle>Above Average Data Visualizations</subtitle><entry><title type="html">The Weather in Portland</title><link href="https://www.themendozaline.org/2017/11/portland-weather" rel="alternate" type="text/html" title="The Weather in Portland" /><published>2017-11-08T00:00:00+00:00</published><updated>2017-11-08T00:00:00+00:00</updated><id>https://www.themendozaline.org/2017/11/portland-weather</id><content type="html" xml:base="https://www.themendozaline.org/2017/11/portland-weather"><![CDATA[<style>
  .xAxis line {
    stroke: black;
    shape-rendering: crispEdges;
  }
  .xAxis path {
    stroke: none;
    shape-rendering: crispEdges;
  }
</style>

<script>
let data;
const dataURL = 'https://gist.githubusercontent.com/mendozaline/75f31235d6f3ebb58189aad1ee748e64/raw/a46417057794f94055b98404c208737cadee9fd0/pdx-weather.csv'

const rowConvert = (d) => {
  return {
    date: new Date(d.date),
    dayMin: +d.daily_temp_min,
    dayMax: +d.daily_temp_max,
    avgMin: +d.avg_temp_min,
    avgMax: +d.avg_temp_max,
    recMin: +d.rec_temp_min,
    recMax: +d.rec_temp_max,
    recMinYr: +d.rec_temp_min_yr,
    recMaxYr: +d.rec_temp_max_yr,
    cRain: d.daily_precip,
    recRain: +d.daily_precip_record,
    recRainYr: +d.precip_daily_record_yr
  }
}

d3.csv(dataURL, rowConvert, weather => {
    data = weather
    drawCharts()
})

const drawCharts = () => {
  const chartWidth = parseInt(d3.select('body').style('width')) * 0.947
  const chartHeight = chartWidth / 2

  const chartDiv = d3.select('#charts')
    .append('div')
    .attr('id', 'chart-1')
    .style('width', chartWidth + 'px')
    .style('margin', 'auto')

  const w = parseInt(d3.select('#chart-1').style('width')) * 1
  const h = w / 2
  const pad = {top:h/29, bottom:h/12.5, left:w/20, right:w/100}

  const yearRange = d3.extent(data, d => d.date)
  const startYear = yearRange[0].getUTCFullYear()
  const endYear = yearRange[1].getUTCFullYear()

  const currentYr = d3.select('#chart-1')
    .append('h3')
    .text(2017)
    .attr('id', 'year')
    .style('margin', 'auto')
    .style('width', '90%')
    .style('text-align', 'center')

  const sliderDiv = d3.select('#chart-1')
    .append('div')
    .attr('id', 'slider-div')
    .style('margin', '1% auto')
    .style('max-width', '1000px')
    .style('width', '75%')

  const yearLabelStart = d3.select('#slider-div')
    .append('h3')
    .text(startYear)
    .style('float', 'left')
    .style('margin', '0')

  const yearLabelEnd = d3.select('#slider-div')
    .append('h3')
    .text(endYear)
    .style('float', 'right')
    .style('margin', '0')

  const inputDiv = d3.select('#slider-div')
    .append('div')
    .attr('id', 'input-div')
    .style('margin', 'auto')
    .style('width', '75%')

  const slider = d3.select('#input-div')
    .append('input')
    .attr('type', 'range')
    .attr('id', 'slider')
    .attr('min', startYear)
    .attr('max', endYear)
    .attr('step', 1)
    .attr('value', 2017)
    .style('margin', '0')
    .style('width', '100%')
    .style('background-color', 'white')
    .style('border', '1px solid white')

   const svg = d3.select('#chart-1')
    .append('svg')
    .attr('width', w + 'px')
    .attr('height', h + 'px')

  const filterData2017 = data.filter(d => {
    return d.date > new Date('2016, 12, 31') && d.date < new Date('2017, 12, 31')
  })

  const xMinMax = d3.extent(filterData2017, d => d.date)
  const xScale = d3.scaleTime()
    .domain([xMinMax[0], xMinMax[1]])
    .range([0 + pad.left, w - pad.right])

  const yMin = d3.min(filterData2017, d => d.recMin)
  const yMax = d3.max(filterData2017, d => d.recMax)
  const yScale = d3.scaleLinear()
    .domain([-25, 115])
    .range([h - pad.bottom, 0 + pad.top])

  const months = ['Jan', 'Feb', 'March', 'April', 'May', 'June', 'July', 'Aug', 'Sept', 'Oct', 'Nov', 'Dec']
  const xBand = d3.scaleBand()
    .domain(months)
    .range([0 + pad.left, w - pad.right])
    .paddingInner(0.05)
    .paddingOuter(0.025)

  const areaLineG = svg.append('g')
    .attr('class', 'chart-paths')

  const maxLineGen = d3.line()
    .defined(d => d.recMax)
    .curve(d3.curveStep)
    .x(d => xScale(d.date))
    .y(d => yScale(d.recMax))

  const maxLine = areaLineG.append('path')
    .datum(filterData2017)
    .attr('class', 'crimson')
    .attr('d', maxLineGen)
    .style('fill', 'none')
    .style('opacity', 1.0)
    .style('stroke', 'crimson')
    .style('stroke-width', h/280)

  const minLineGen = d3.line()
    .defined(d => d.recMin)
    .curve(d3.curveStep)
    .x(d => xScale(d.date))
    .y(d => yScale(d.recMin))

  const minLine = areaLineG.append('path')
    .datum(filterData2017)
    .attr('class', 'dodgerBlue')
    .attr('d', minLineGen)
    .style('fill', 'none')
    .style('opacity', 1.0)
    .style('stroke', 'dodgerBlue')
    .style('stroke-width', h/280)

  const avgAreaGen = d3.area()
    .defined(d => d.avgMin && d.avgMax)
    .curve(d3.curveStep)
    .x(d => xScale(d.date))
    .y0(d => yScale(d.avgMin))
    .y1(d => yScale(d.avgMax))

  const avgArea = areaLineG.append('path')
    .datum(filterData2017)
    .attr('class', 'gray')
    .attr('d', avgAreaGen)
    .style('fill', 'lightGray')
    .style('opacity', 0.75)
    .style('stroke', 'black')
    .style('stroke-width', h/750)

  const dayAreaGen = d3.area()
    .defined(d => d.dayMin && d.dayMax)
    .curve(d3.curveStep)
    .x(d => xScale(d.date))
    .y0(d => yScale(d.dayMin))
    .y1(d => yScale(d.dayMax))

  const dayArea = areaLineG.append('path')
    .datum(filterData2017)
    .attr('class', 'orange')
    .attr('d', dayAreaGen)
    .style('fill', 'darkOrange')
    .style('opacity', 0.66)
    .style('stroke', 'black')
    .style('stroke-width', h/500)

  const maxLabel = areaLineG.append('text')
    .attr('x', xScale(new Date('2017, 4, 24')) )
    .attr('y', yScale(102.5) )
    .attr('fill', 'crimson')
    .attr('font-size', w/50)
    .attr('font-weight', 'bold')
    .attr('text-anchor', 'end')
    .text('Record daily high')

  const dailyLabel = areaLineG.append('text')
    .attr('x', xScale(new Date('2017, 4, 24')) )
    .attr('y', yScale(92.5) )
    .attr('fill', 'darkOrange')
    .attr('font-size', w/50)
    .attr('font-weight', 'bold')
    .attr('text-anchor', 'end')
    .text('Daily high/low')

  const avgLabel = areaLineG.append('text')
    .attr('x', xScale(new Date('2017, 4, 24')) )
    .attr('y', yScale(10) )
    .attr('fill', 'darkGray')
    .attr('font-size', w/50)
    .attr('font-weight', 'bold')
    .attr('text-anchor', 'end')
    .text('Avg. daily high/low')

  const minLabel = areaLineG.append('text')
    .attr('x', xScale(new Date('2017, 4, 24')) )
    .attr('y', yScale(0) )
    .attr('fill', 'dodgerBlue')
    .attr('font-size', w/50)
    .attr('font-weight', 'bold')
    .attr('text-anchor', 'end')
    .text('Record low')

  const rainLabel = areaLineG.append('text')
    .attr('x', xScale(new Date('2017, 6, 30')) )
    .attr('y', yScale(-14) )
    .attr('fill', 'teal')
    .attr('font-size', w/50)
    .attr('font-weight', 'bold')
    .attr('text-anchor', 'middle')
    .text('Daily precipitation')

  const monthG = svg.append('g')
    .attr('class', 'month-labels')

  const monthGG = monthG.selectAll('g')
    .data(d3.range(1,13,1))
    .enter()
    .append('g')

  monthGG.append('line')
    .filter(d => d !== 1)
    .attr('class', 'vertical')
    .attr('x1', d => xScale(new Date('2017, ' + d + ', 1')))
    .attr('y1', yScale.range()[1])
    .attr('x2', d => xScale(new Date('2017, ' + d + ', 1')))
    .attr('y2', h - pad.bottom)
    .attr('stroke', 'dimGray')
    .attr('stroke-dasharray', '5,5')
    .style('stroke-width', h/800)

  monthGG.append('text')
    .attr('class', 'month')
    .attr('x', d => xScale(new Date('2017, ' + d + ', 1')) + xBand.bandwidth()/2)
    .attr('y', yScale.range()[1] + 1)
    .attr('font-size', w/55 + 'px')
    .attr('text-anchor', 'middle')
    .text(d => new Date('2017, ' + (d) + ', 1').toString().split(' ')[1])

  const xLinePos = w/23
  const xTextPos = w/26
  const customYAxis = svg.append('g')
    .attr('class', 'yAxis')

  const yLineAxis2 = customYAxis.append('line')
    .attr('x1', xLinePos)
    .attr('y1', yScale(yMax))
    .attr('x2', xLinePos)
    .attr('y2', yScale(yMin))
    .attr('stroke', 'black')
    .attr('stroke-width', h/500)

  const axisMaxLine = customYAxis.append('line')
    .attr('x1', xLinePos - w/200)
    .attr('y1', yScale(yMax))
    .attr('x2', xLinePos + w/200)
    .attr('y2', yScale(yMax))
    .style('stroke', 'crimson')
    .attr('stroke-width', h/400)
  const axisMinText = customYAxis.append('text')
    .attr('x', xTextPos)
    .attr('y', yScale(yMax - 1.25))
    .attr('fill', 'crimson')
    .attr('font-size', h/40)
    .attr('text-anchor', 'end')
    .text(yMax + '°F')

  const axisMinLine = customYAxis.append('line')
    .attr('x1', xLinePos - w/200)
    .attr('y1', yScale(yMin))
    .attr('x2', xLinePos + w/200)
    .attr('y2', yScale(yMin))
    .style('stroke', 'dodgerBlue')
    .attr('stroke-width', h/400)
  const axisMinText2 = customYAxis.append('text')
    .attr('x', xTextPos)
    .attr('y', yScale(yMin - 1.25))
    .attr('fill', 'dodgerBlue')
    .attr('font-size', h/40)
    .attr('text-anchor', 'end')
    .text(yMin + '°F')

  for (let ww = 10 ; ww <= 100; ww+=20) {
    customYAxis.append('line')
      .attr('x1', xLinePos - w/200)
      .attr('y1', yScale(ww) )
      .attr('x2', xLinePos + w/200)
      .attr('y2', yScale(ww) )
      .attr('stroke-width', h/400)

    customYAxis.append('text')
      .attr('x', xTextPos)
      .attr('y', yScale(ww))
      .attr('font-size', h/40)
      .attr('text-anchor', 'end')
      .text(ww + '°F')
  }

  const xAxis = svg.append('g')
    .attr('class', 'xAxis')
    .attr('transform', 'translate('+ 0 + ',' + (h - pad.bottom) + ')')
    .style('font-size', w/75 + 'px')
    .style('text-anchor', 'middle')
    .call(d3.axisBottom(xScale).tickFormat(d3.timeFormat('%b-%d')).ticks(10))

  const rainChart = svg.append('g')
    .attr('class', 'rain-chart')

  const yRainMinMax = d3.extent(data, d => +d.cRain)
  const yScaleRain = d3.scaleLinear()
    .domain([0, yRainMinMax[1]])
    .range([yScale(yScale.domain()[0]), yScale(yMin)])

  const rainRects = rainChart.selectAll('rect.rain-bars')
    .data(filterData2017, d => d.date)
    .enter()
    .append('rect')
    .attr('class', 'rain-bars')
    .attr('x', d => xScale(d.date))
    .attr('y', d => d.cRain === 'T' ? yScaleRain(0) : yScaleRain(+d.cRain))
    .attr('width', w/475)
    .attr('height', d => yScaleRain.range()[0] - (d.cRain === '0' ? yScaleRain(0.0001) : d.cRain === 'T' ? yScaleRain(0.001) : yScaleRain(+d.cRain)))
    .attr('fill', 'teal')
    .attr('opacity', 1.0)

  rainRects.append('title')
    .text(d => d.date.toUTCString() + ': ' + d.cRain + '"')

  const customRainAxis = svg.append('g')
    .attr('class', 'my-rainAxis-')

  const yLineAxis = customRainAxis.append('line')
    .attr('x1', xLinePos)
    .attr('y1', yScaleRain(2) )
    .attr('x2', xLinePos)
    .attr('y2', yScaleRain(yRainMinMax[0]) )
    .attr('stroke', 'black')
    .attr('stroke-width', h/500)

  for (let m = 0; m <= 2; m++) {
    customRainAxis.append('line')
      .attr('x1', xLinePos - w/200)
      .attr('y1', yScaleRain(m))
      .attr('x2', xLinePos + w/200)
      .attr('y2', yScaleRain(m))
      .attr('stroke', m === 1 ? 'teal' : 'black')
      .attr('stroke-width', h/400)

    customYAxis.append('text')
      .attr('x', xTextPos)
      .attr('y', yScaleRain(m - 0.1))
      .attr('fill', 'teal')
      .attr('font-size', h/35)
      .attr('text-anchor', 'end')
      .text(m === 0 || m === 2 ? '' : m + '"')
  }

  for (let n = 1; n <= 2; n++) {
    rainChart.append('line')
      .attr('class', 'rain-gridlines')
      .attr('x1', xScale(new Date('2016, 12, 31')))
      .attr('y1', yScaleRain(n))
      .attr('x2', xScale(new Date('2017, 12, 31')))
      .attr('y2', yScaleRain(n))
      .attr('stroke', 'white')
      .style('stroke-width', h/250)
      .attr('opacity', 1.0)
      .attr('pointer-events', 'none')
  }

  let chartHover = svg.append('g')
    .attr('class', 'hover')

  let hoverRects = chartHover.selectAll('rect.hover')
    .data(filterData2017)
    .enter()
    .append('rect')
    .attr('class', 'hover')
    .attr('x', d => xScale(d.date))
    .attr('y', d => yScale(yMax))
    .attr('width', w/475)
    .attr('height', yScale(yScale.domain()[0]) - yScale(yMax)) //top
    .attr('fill', 'black')
    .attr('cursor', 'crosshair')
    .attr('opacity', 0.0)

  hoverRects.append('title')
    .text(d => d.date.toUTCString())

  let hovered = (dd,i) => {
    let thisDay = dd.date.toUTCString().split(',')[1]
    let date = chartHover.append('text')
      .attr('class', 'hoverCirc')
      .attr('x', xScale(dd.date))
      .attr('y', yScale(yScale.domain()[1] - 5))
      .attr('text-anchor', 'middle')
      .attr('font-size', w/75)
      .attr('font-weight', 'bold')
      .text(thisDay.slice(0,3))

    let recMax = chartHover.append('circle')
      .attr('class', 'hoverCirc')
      .attr('cx', xScale(dd.date))
      .attr('cy', yScale(dd.recMax))
      .attr('r', w/105)
      .attr('fill', 'crimson')
      .attr('stroke', 'black')
      .attr('stroke-width', w/1500)
      .attr('opacity', 0.75)
      .attr('pointer-events', 'none')

    let recMin = chartHover.append('circle')
      .attr('class', 'hoverCirc')
      .attr('cx', xScale(dd.date))
      .attr('cy', yScale(dd.recMin))
      .attr('r', w/105)
      .attr('fill', 'dodgerBlue')
      .attr('stroke', 'black')
      .attr('stroke-width', w/1500)
      .attr('opacity', 0.75)
      .attr('pointer-events', 'none')

    let dayMax = chartHover.append('circle')
      .attr('class', 'hoverCirc')
      .attr('cx', xScale(dd.date))
      .attr('cy', yScale(dd.dayMax))
      .attr('r', w/105)
      .attr('fill', 'darkOrange')
      .attr('stroke', 'black')
      .attr('stroke-width', w/1500)
      .attr('opacity', dd.dayMax === 0 ? 0.0 : 0.75)
      .attr('pointer-events', 'none')

    let dayMin = chartHover.append('circle')
      .attr('class', 'hoverCirc')
      .attr('cx', xScale(dd.date))
      .attr('cy', yScale(dd.dayMin))
      .attr('r', w/105)
      .attr('fill', 'darkOrange')
      .attr('stroke', 'black')
      .attr('stroke-width', w/1500)
      .attr('opacity', dd.dayMax === 0 ? 0.0 : 0.75)
      .attr('pointer-events', 'none')

    recMax = chartHover.append('text')
      .attr('class', 'hoverCirc')
      .attr('x', xScale(dd.date))
      .attr('y', yScale(dd.recMax - 1.5))
      .attr('fill', 'black')
      .attr('font-size', w/75)
      .attr('font-weight', 'bold')
      .attr('text-anchor', 'middle')
      .attr('pointer-events', 'none')
      .text(dd.recMax)

    recMin = chartHover.append('text')
      .attr('class', 'hoverCirc')
      .attr('x', xScale(dd.date))
      .attr('y', yScale(dd.recMin - 1.5))
      .attr('fill', 'black')
      .attr('font-size', w/75)
      .attr('font-weight', 'bold')
      .attr('text-anchor', 'middle')
      .attr('pointer-events', 'none')
      .text(dd.recMin)

    dayMax = chartHover.append('text')
      .attr('class', 'hoverCirc')
      .attr('x', xScale(dd.date))
      .attr('y', yScale(dd.dayMax - 1.5))
      .attr('fill', 'black')
      .attr('font-size', w/75)
      .attr('font-weight', 'bold')
      .attr('text-anchor', 'middle')
      .attr('opacity', dd.dayMax === 0 ? 0.0 : 0.75)
      .attr('pointer-events', 'none')
      .text(dd.dayMax)

    dayMin = chartHover.append('text')
      .attr('class', 'hoverCirc')
      .attr('x', xScale(dd.date))
      .attr('y', yScale(dd.dayMin - 1.5))
      .attr('fill', 'black')
      .attr('font-size', w/75)
      .attr('font-weight', 'bold')
      .attr('text-anchor', 'middle')
      .attr('opacity', dd.dayMax === 0 ? 0.0 : 0.75)
      .attr('pointer-events', 'none')
      .text(dd.dayMin)

    let rainText = +dd.cRain
    let rainInch = chartHover.append('text')
      .attr('class', 'hoverCirc')
      .attr('x', xScale(dd.date) - w/110)
      .attr('y', dd.cRain === 'T' ?  yScaleRain(0 + 0.1) : yScaleRain(+dd.cRain + 0.05))
      .attr('fill', 'teal')
      .attr('font-size', w/70)
      .attr('font-weight', 'bolder')
      .attr('stroke', 'white')
      .attr('stroke-width', w/1750)
      .attr('text-anchor', 'start')
      .attr('text-anchor', dd.cRain === 'T' ?  'start' : 'start')
      .attr('pointer-events', 'none')
      .text(dd.cRain === 'T' ?  'Trace' :
            dd.cRain === '' ? '' :
            dd.cRain === '0' ? rainText.toFixed(1) + '"' : rainText + '"')
  }

  hoverRects.on('mouseover', (d,i) => {
    hovered(d,i)
  })
  .on('mouseout', d => {
    d3.selectAll('.hoverCirc')
      .remove()
  })

  d3.select('#slider').on('change', function () {
    let value = +d3.select(this).node().value
    currentYr.text(value)

    let filterData = data.filter(d => d.date > new Date( (value - 1) + ', 12, 31') && d.date < new Date(value + ', 12, 31'))

    let xMinMax = d3.extent(filterData, d => d.date)
    xScale.domain([xMinMax[0], xMinMax[1]])
    xAxis.call(d3.axisBottom(xScale).tickFormat(d3.timeFormat('%b-%d')).ticks(10))

    d3.selectAll('path.dodgerBlue')
      .datum(filterData)
      .transition()
      .duration(1000)
      .attr('class', 'dodgerBlue')
      .attr('d', minLineGen)
      .style('fill', 'none')
      .style('opacity', 1.0)
      .style('stroke', 'dodgerBlue')
      .style('stroke-width', h/280)

    d3.selectAll('path.crimson')
      .datum(filterData)
      .transition()
      .duration(1000)
      .attr('class', 'crimson')
      .attr('d', maxLineGen)
      .style('fill', 'none')
      .style('opacity', 1.0)
      .style('stroke', 'crimson')
      .style('stroke-width', h/280)

    d3.selectAll('path.gray')
      .datum(filterData)
      .transition()
      .duration(1000)
      .attr('class', 'gray')
      .attr('d', avgAreaGen)
      .style('fill', 'lightGray')
      .style('opacity', 0.75)
      .style('stroke', 'black')
      .style('stroke-width', h/750)

    d3.selectAll('path.orange')
      .datum(filterData)
      .transition()
      .duration(1000)
      .attr('class', 'orange')
      .attr('d', dayAreaGen)
      .style('fill', 'darkOrange')
      .style('opacity', 0.66)
      .style('stroke', 'black')
      .style('stroke-width', h/500)

    let oldBars = rainChart.selectAll('rect')
      .data(filterData, d => d.date)

    oldBars.exit()
      .remove()

    let newBars = oldBars.enter()
      .append('rect')
      .attr('class', 'rain-bars')
      .attr('x', d => xScale(d.date))
      .attr('y', d => d.cRain === 'T' ? yScaleRain(0) : yScaleRain(+d.cRain))
      .attr('width', w/475)
      .attr('height', d => yScaleRain.range()[0] - (d.cRain === '0' ? yScaleRain(0.0001) : d.cRain === 'T' ? yScaleRain(0.001) : yScaleRain(+d.cRain)))
      .attr('fill', 'teal')
      .attr('opacity', 1.0)

    newBars.append('title')
      .text(d => d.date.toUTCString() + ': ' + d.cRain + '"' )

    let allBars = newBars.merge(oldBars)
      .transition()
      .duration(750)
      .on('start', function() {
        d3.select(this)
          .attr('y', d => yScaleRain(0))
          .attr('height', 0)
      })
      .transition()
      .duration(500)
      .ease(d3.easeBackOut)
      .attr('y', d => d.cRain === 'T' ? yScaleRain(0) : yScaleRain(+d.cRain))
      .attr('height', d => yScaleRain.range()[0] - (d.cRain === '0' ? yScaleRain(0.0001) : d.cRain === 'T' ? yScaleRain(0.001) : yScaleRain(+d.cRain)))

    for (let n = 1; n <= 2; n++) {
      rainChart.append('line')
        .attr('class', 'rain-gridlines')
        .attr('x1', xScale(new Date((value - 1) + ', 12, 31')))
        .attr('y1', yScaleRain(n))
        .attr('x2', xScale(new Date(value + ', 12, 31')))
        .attr('y2', yScaleRain(n))
        .attr('stroke', 'white')
        .style('stroke-width', h/250)
        .attr('opacity', 1.0)
        .attr('pointer-events', 'none')
    }

    let oldHover = chartHover.selectAll('rect')
      .data(filterData, d => d.date)

    oldHover.exit()
      .remove()

    let newHover = oldHover.enter()
      .append('rect')
      .attr('class', 'hover')
      .attr('x', d => xScale(d.date))
      .attr('y', d => yScale(yMax))
      .attr('width', w/475)
      .attr('height', yScale(yScale.domain()[0]) - yScale(yMax)) //top
      .attr('fill', 'black')
      .attr('cursor', 'crosshair')
      .attr('opacity', 0.0)

    newHover.append('title')
      .text(d => d.date.toUTCString())

    newHover.on('mouseover', (d,i) => {
      hovered(d,i)
    })
    .on('mouseout', d => {
      d3.selectAll('.hoverCirc')
        .remove()
    })

    monthG.selectAll('line')
      .data(d3.range(1,13,1))
      .filter(d => d !== 1)
      .attr('x1', d => xScale(new Date(value + ', ' + d + ', 1')))
      .attr('x2', (d, i) => xScale(new Date(value + ', ' + d + ', 1')))

    monthG.selectAll('text')
      .data(d3.range(1,13,1))
      .attr('x', d => xScale(new Date(value + ', ' + d + ', 1')) + xBand.bandwidth()/2)
  })
}

const resize = () => {
  d3.selectAll('div#chart-1').remove()
  d3.selectAll('svg').remove()
  drawCharts()
}

d3.select(window).on('resize', resize);
</script>]]></content><author><name>David Mendoza</name></author><summary type="html"><![CDATA[]]></summary></entry><entry><title type="html">This Bubble Chart is Killing Me</title><link href="https://www.themendozaline.org/2014/08/25/bubble-chart" rel="alternate" type="text/html" title="This Bubble Chart is Killing Me" /><published>2014-08-25T00:00:00+00:00</published><updated>2014-08-25T00:00:00+00:00</updated><id>https://www.themendozaline.org/2014/08/25/this-bubble-chart-is-killing-me</id><content type="html" xml:base="https://www.themendozaline.org/2014/08/25/bubble-chart"><![CDATA[<p><img src="https://i.imgur.com/M7FfhbC.png" alt="Scatter Plot" /></p>

<p>Last week, Julia Belluz of Vox <a href="https://www.vox.com/2014/8/20/6040435/als-ice-bucket-challenge-and-why-we-give-to-charity-donate">argued</a> that people inefficiently donate money to charity. Rather than directing donations towards fighting the diseases that ravage the most people, we give money for less pragmatic reasons. For instance, someone might donate to a charity in order to honor a family member killed by a certain disease. While commemorating someone with a donation is reasonable, Belluz believes allowing our donations to be influenced by celebrities and viral marketing campaigns is not.</p>

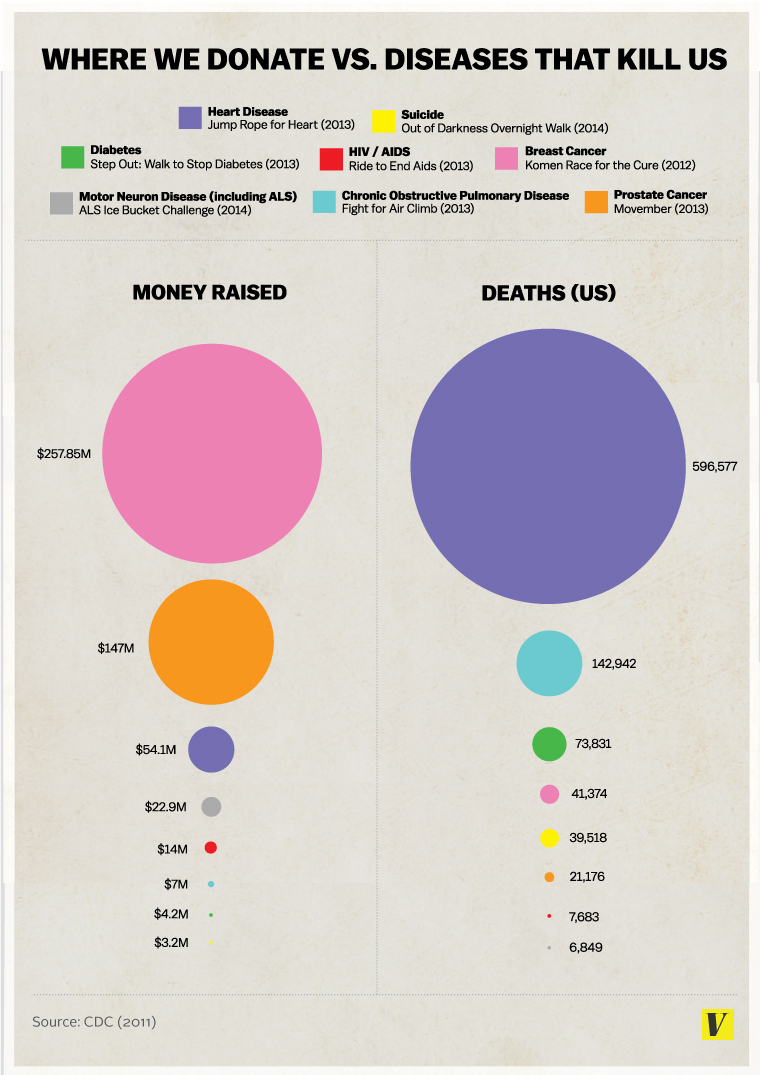
<p>Belluz points to the Ice Bucket Challenge as an example of how good publicity can attract more money than actual death tolls. To show this, the article includes <a href="https://cdn3.vox-cdn.com/uploads/chorus_asset/file/663618/Donating.vs.Death-Graph.0.jpg">this bubble chart</a> that displays the number of people killed by eight diseases on the right side and the amount of money raised by fundraisers associated with those same diseases on the left. It purports to show how the ALS Association has raised more money than other fundraisers, despite the fact that motor-neuron diseases like ALS kill comparatively fewer people. As of today, this bubble chart has been shared over 7,000 times on Facebook. It’s unfortunate then that though the numbers presented in the chart are accurate, the way the data is displayed is not. I reveal why below and explain how my scatter plot above displays the data more honestly.</p>

<p><img src="https://i.imgur.com/FaityDQ.png" alt="Bubble Chart" /></p>

<p>The major problem with Vox’s bubble chart is that it attempts to scale each circle by adjusting its diameter. However, this exaggerates the degree of change in the actual numerical values shown on the chart because by adjusting a circle’s diameter, it does not proportionally change its area. For example, the big pink circle represents a value of $257.85 million, which means it should be 1.75 times bigger than the orange circle below it. But as we see in the chart above, we could fit at least two orange circles inside the pink circle. By adjusting the diameter of each circle and not its area, the pink circle is nearly twice as large as it should be. This error repeats itself throughout the graphic.</p>

<p>However, even if the data was displayed correctly, it should not have been presented in the form of a bubble chart. In fact, it’s rarely a good idea to use a bubble chart to visualize data — especially if you’re trying to show the relationship between two variables. Edward Tufte <a href="https://www.edwardtufte.com/tufte/books_vdqi">clarifies</a> why in his book “The Visual Display of Quantitative Information.” In it, he stated:</p>

<blockquote>
  <p>The use of two (or three) varying dimensions to show one-dimensional data is a weak and inefficient technique, capable of handling only very small data sets, often with error in design and ambiguity in perception. These designs cause so many problems that they should be avoided.</p>
</blockquote>

<p>Kaiser Fung, adjunct professor of statistics at NYU, <a href="http://junkcharts.typepad.com/junk_charts/2013/03/blowing-the-whistle-at-bubble-charts.html">agrees</a> with Tufte, writing on his blog Junk Charts that the bubble chart is “one of the most hopeless data graphics ever invented.”</p>

<p>So with that in mind, I decided to redesign Vox’s chart. I chose a scatter plot because it clearly shows how skewed donations are to some charities when we consider how many people die from those diseases. Along the x-axis, I plotted the total number of deaths caused by the eight diseases examined by Vox. We immediately see how many more Americans heart disease kills than the other 7 diseases combined, yet <a href="https://www.heart.org/HEARTORG/Giving/ForSchools/For-Schools_UCM_313648_SubHomePage.jsp">Jump Rope For Heart</a> — a fundraiser put on by the American Heart Association — raises substantially less money than either breast or prostate cancer charities. On the left side of the x-axis, you’ll find motor-neuron diseases, which kills the fewest people each year among these eight diseases. But thanks to the success of the Ice Bucket Challenge, it’s now the disease with the fourth most successful fundraiser.</p>

<p>The point Belluz tries to make in her piece is a noble one: that we should donate more money to charities that benefit the most people and do so efficiently. Regrettably, this point is lost in the poorly designed chart that accompanies her thoughtful piece.</p>

<p>Update: I’d like to thank the great Alberto Cairo for <a href="https://twitter.com/albertocairo/status/504010022167535616">tweeting</a> about this post.</p>]]></content><author><name>David Mendoza</name></author><summary type="html"><![CDATA[]]></summary></entry><entry><title type="html">The Spectacular Success of the Measles Vaccine</title><link href="https://www.themendozaline.org/2014/06/measles" rel="alternate" type="text/html" title="The Spectacular Success of the Measles Vaccine" /><published>2014-06-14T00:00:00+00:00</published><updated>2014-06-14T00:00:00+00:00</updated><id>https://www.themendozaline.org/2014/06/spectacular-success-measles-vaccine</id><content type="html" xml:base="https://www.themendozaline.org/2014/06/measles"><![CDATA[<p><img src="https://i.imgur.com/zexxSW4.png" alt="Heat Map" /></p>

<p>Recently, there has been <a href="https://www.vox.com/2014/5/29/5762064/measles-is-making-a-comeback-because-people-arent-getting-vaccinated">increased</a> attention paid to the <a href="https://www.nytimes.com/2014/05/30/health/measles-cases-in-us-hit-a-20-year-high.html">resurgence</a> of measles in the United States. But despite this uptick, it’s important to remember how effective the measles vaccine has been at reducing the prevalence of the disease. Since 1963, when John F. Enders helped develop the first vaccine against the measles, the number of cases of this respiratory disease has declined considerably. By the end the 1960s, according to Samuel L. Katz, Chairman Emeritus of Pediatrics at Duke University, “annual measles cases had been <a href="https://books.google.com/books?id=wZ41S3CKVPYC&amp;lpg=PP1&amp;pg=PA8&amp;hl=en#v=onepage&amp;q&amp;f=false">reduced</a> by more than 90%.” Immediately before then, approximately <a href="https://www.cdc.gov/measles/about/faqs.html#how-common">400 people died</a> and more than 3 million people were infected by measles every year.</p>

<p>The chart at the top of the page displays the remarkable reduction in the measles incidence rate per 100,000 people in the United States. The incidence rate is <a href="https://www.cdc.gov/vaccines/terms/glossary.html">defined</a> by the CDC as the number of new cases of a disease over a given period that is then divided by the average population of a locality. So in this cases, the incidence rate measures the number of measles cases reported to the CDC adjusted for each state’s population. The chart is ordered from the states with the highest average incidence rate at the top and the states with the lowest rates at the bottom. I gathered the data for this visualization from <a href="https://www.tycho.pitt.edu/#about-us">Project Tycho</a>, a database maintained by the University of Pittsburgh. The researchers at Project Tycho culled their data from weekly surveillance reports from the <a href="https://wwwn.cdc.gov/nndss/">National Notifiable Diseases Surveillance System (NNDSS)</a>. Specifically, I used <a href="https://www.tycho.pitt.edu/data/">Level 1 data</a>, which has been standardized into a common format for easier analysis.</p>

<p>The measles vaccine was so effective that the United States <a href="http://jid.oxfordjournals.org/content/189/Supplement_1/S43.full">eliminated</a> endemic measles at the end of the 20th century. This does not mean people are no longer infected by the disease; rather, it signifies that indigenous cases of measles are no longer a continuous threat. In 2004, the Task Force for Child Survival and Development <a href="http://jid.oxfordjournals.org/content/189/Supplement_1/S43.full">determined</a> that from 1997 to 1999, the measles incidence rate fell below 1 case per 1 million people. Most of the 338 cases reported during that period were either imported into the country or could be linked to international strains of the disease. Earlier this year, the elimination of endemic measles was extended into the 21st century. In a <a href="https://jamanetwork.com/journals/jamapediatrics/fullarticle/1787786">study</a> published by <em>JAMA Pediatrics</em>, researchers found that between 2000 and 2011, the measles incidence rate remained below 1 case per 1 million people.</p>

<p>Despite the overall decrease in measles, imported cases of the disease remains an urgent issue — as the CDC <a href="https://www.cdc.gov/media/releases/2014/p0529-measles.html">announced</a> last month. The CDC noted that during the first five months of 2014, the second most cases of measles were reported since the same period in 1994. Most of the 288 cases reported were imported from abroad — <a href="https://wwwnc.cdc.gov/travel/notices/watch/measles-philippines">particularly from the Philippines</a>. Between 2001 and 2011, around 89% of the measles cases <a href="https://www.cdc.gov/vaccines/pubs/surv-manual/chpt07-measles.html">reported</a> to the CDC were imported from outside the United States. This has become an even larger problem because people are not getting their children vaccinated. The CDC noted that 9 in 10 cases of measles in 2014 were contracted by people who were either not vaccinated or did not know their vaccination status.</p>

<p><strong>Update:</strong> I’d like to thank the amazing Susannah Locke for featuring my chart on <a href="https://www.vox.com/2014/6/19/5824390/the-measles-vaccine-works-in-one-chart">Vox</a>!</p>]]></content><author><name>David Mendoza</name></author><summary type="html"><![CDATA[]]></summary></entry></feed>